Web site performance matters, and there are great (and free!) tools that you can use to benchmark your web site performance. Here are three tools that you can use to make sure your website runs as fast as possible.
Recently, we just updated our own web site and we wanted to make sure it's fast. We're using www.innota.co as our test URL in the following tests.
Why does Performance Matter?
Simply put, people love fast websites. There are a number of studies that show that faster websites lead to better user engagement, better retention and more sales. That should be the goal for anyone running a business.
There are a number of tools you can use to benchmark your site performance. We're going to use three free tools in this guide: Apache Benchmark, Google PageSpeed Insights and Pingdom Website Speed Test.
1. Testing with Apache Benchmark
Apache Benchmark (ab for short) is mainly used to stress test HTTP servers to see how may requests per second they are able to serve. ab is also the only tool in this guide that you need to install yourself.
This time we're not going to push the boundaries and stress test our site. Instead, we're going to use ab to give us a rough idea what the average page load time is.
With modern cloud service providers it's really easy to spin up a server anywhere in the world. Usually, you only pay for the resources you use and if you don't need the server for a long time, the costs are minimal. I used Amazon Web Services and spinned up two servers, one in Ireland and one in Australia. I installed ab on the servers and hit the the front page of our site.
Here are the results from Ireland:
$ ab -c 200 -n 5000 http://www.innota.co/
This is ApacheBench, Version 2.3 <$Revision: 655654 $>
Copyright 1996 Adam Twiss, Zeus Technology Ltd, http://www.zeustech.net/
Licensed to The Apache Software Foundation, http://www.apache.org/

Benchmarking www.innota.co (be patient)
Finished 5000 requests

Server Software:        nginx/1.8.1
Server Hostname:        www.innota.co
Server Port:            80

Document Path:          /
Document Length:        24899 bytes

Concurrency Level:      200
Time taken for tests:   7.648 seconds
Complete requests:      5000
Failed requests:        0
Write errors:           0
Total transferred:      126997227 bytes
HTML transferred:       124684655 bytes
Requests per second:    653.76 [#/sec] (mean)
Time per request:       305.923 [ms] (mean)
Time per request:       1.530 [ms] (mean, across all concurrent requests)
Transfer rate:          16215.94 [Kbytes/sec] received

Connection Times (ms)
              min  mean[+/-sd] median   max
Connect:       10  135  31.3    142     194
Processing:    61  165 100.2    145    1107
Waiting:       61  142  26.3    140     534
Total:        105  300  88.3    287    1250
So, what we're doing here is we're making 5000 requests (the -n parameter) at a concurrency level of 200 (the -c parameter). We're getting a mean time of 305.923ms per request. That's pretty good!
Lets try the same test from the other side of the world from Australia using a similar EC2 instance. Here are the results:
$ ab -c 200 -n 5000 http://www.innota.co/
This is ApacheBench, Version 2.3 <$Revision: 655654 $>
Copyright 1996 Adam Twiss, Zeus Technology Ltd, http://www.zeustech.net/
Licensed to The Apache Software Foundation, http://www.apache.org/

Benchmarking www.innota.co (be patient)
Finished 5000 requests
Server Software:        nginx/1.8.1
Server Hostname:        www.innota.co
Server Port:            80

Document Path:          /
Document Length:        24899 bytes

Concurrency Level:      200
Time taken for tests:   6.376 seconds
Complete requests:      5000
Failed requests:        0
Write errors:           0
Total transferred:      127263678 bytes
HTML transferred:       124941636 bytes
Requests per second:    784.17 [#/sec] (mean)
Time per request:       255.048 [ms] (mean)
Time per request:       1.275 [ms] (mean, across all concurrent requests)
Transfer rate:          19491.37 [Kbytes/sec] received

Connection Times (ms)
              min  mean[+/-sd] median   max
Connect:       11   92 234.0     36    2022
Processing:    14  153 208.1     40    2272
Waiting:       12   56  71.9     38    1003
Total:         25  245 331.6     77    2299
From Australia we got a mean time of 255.048ms per request. That's even better than from Ireland!
These results aren't the whole truth. I used a really small micro instances with limited networking capabilities and really stress testing Innota would require more powerful machines to run the test on. But this gives us an insight to what kind of performance we're talking about, a sort of baseline. The good news is that even with this kind of load there are zero failed requests and the average page load time is roughly the same from everywhere in the world.
ab is quite an old tool and it doesn't understand anything about the content of the HTML page it loads. It just loads the HTML but doesn't load external assets like CSS or JavaScript files or images. There are more modern and advanced tools that also analyze the content of the page. Lets try some of those tools.
2. Google PageSpeed Insights
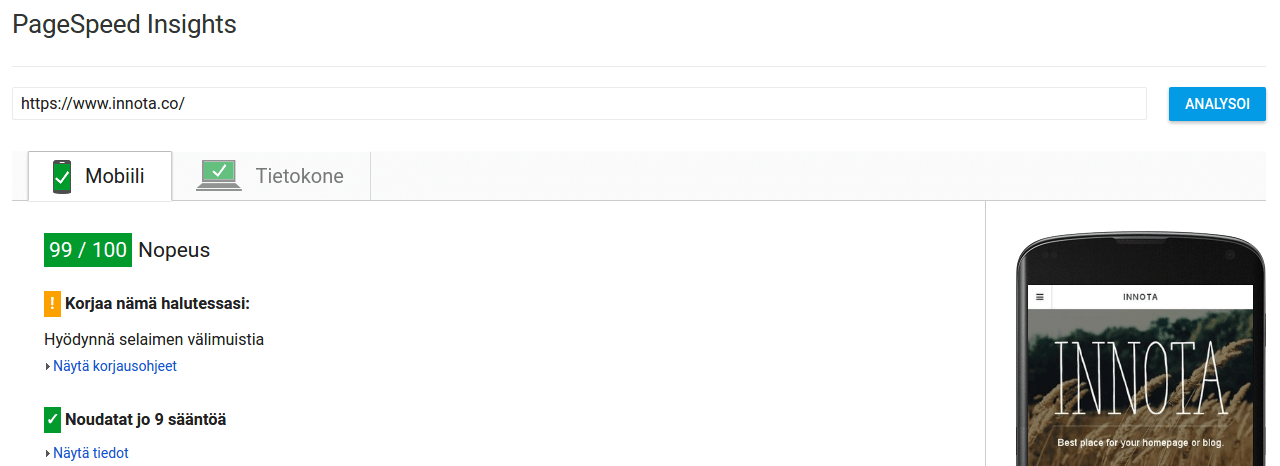
Google is trying hard to make the web faster. Their search engine ranks faster web sites higher and they've built free tools you can use to make your own website faster. PageSpeed Insights is one of those tools.
Page Speed Insights measures the performance of a page for mobile devices and desktop devices. It fetches the url twice, once with a mobile user-agent, and once with a desktop-user agent.
PageSpeed Insights is really easy to use. You just give it a URL and it will give a score and tell you what you can do to improve it.
We achieved a great score for both mobile and desktop: 99/100! This is a great score when you take into account how little we had to do ourselves and how much Innota already did for us. PageSpeed Insights will give you a detailed analysis what you can do to improve your site's performance. Here are the key things that PageSpeed Insights checks that we have already done:
- Innota optimizes images,
- Static assets (images, JavaScript and CSS) are aggressively cached, compressed and minified,
- Inlining CSS is easy with
inlince_css()function, - Our server infrastructure is among the fastest in the world.
The only thing that requires some manual work from us is inlining CSS. First, we built the site without any inlined CSS. After we were happy with the results, we took some of the critical CSS from the external file and created a new file for inlining it. This was a pretty simple and straightforward process, but it requires some understanding what CSS is required to render the above the fold content.
Room for Improvement?
Like its name suggests, the service gives you insights about what you can do to make your web pages faster. These insights don't always correlate well with the real world. For instance, if you rely heavily on external services like Google Analytics or Disqus comments, PageSpeed Insights will complain about caching those external JavaScripts.
In our case PageSpeed Insights complains about caching an external JavaScript file. This file is required to use Facebook comments on our blog. Also, we haven't enabled Google Analytics yet, so I'm sure we'll lose a point or two after that. This is a good reminder that loading a lot of external JavaScript based services will have an impact on your page performance.
But remember that these are just insights, so don't go over the board trying to increase your score from 99 to 100.
3. Pingdom Website Speed Test
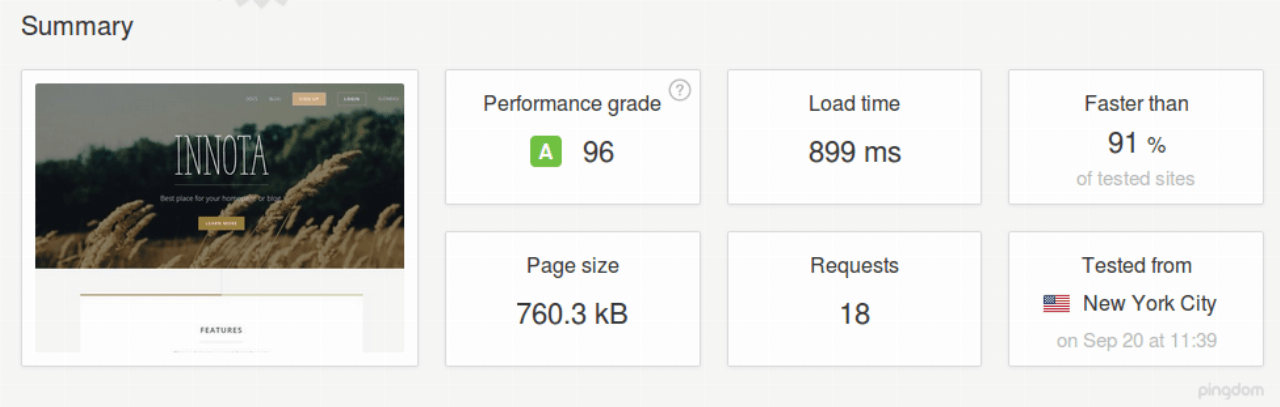
Pingdom Website Speed Test is another more advanced and easy to use tool to analyze the performance of a website. It also supports testing the performance from different locations around the world and this time we decided to test our site from New York, US and Melbourne, Australia.
All you need to do is to give Pingdom your URL and wait for it to do the analysis. Here are the results from New York:
And here the results from Melbourne:
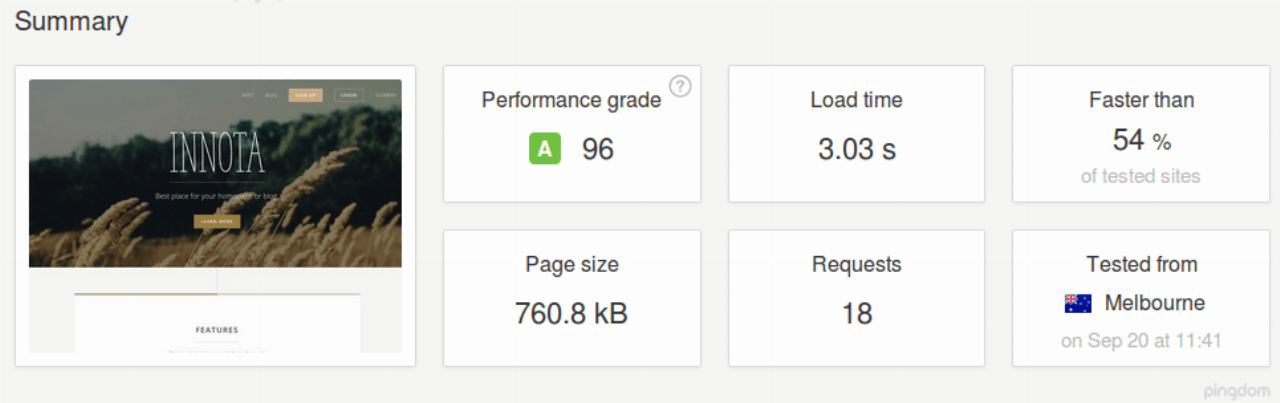
I'm a little surprised that the results are that bad when tested from Melbourne compared to the results from New York. Also, ab gave us a mean time of less than 0.3s when we tested it from Australia. There are quite a lot of variables in this (even on Pingdom side) and I'm not too worried about the results from Australia.
Where to Go From Here?
The best part in Google PageSpeed Insights and Pingdom Website Speed Test are the insights they give you. Usually, the insights are spot on and Google goes even further and lets you download optimized assets if that's your weak spot.
I'm pretty happy with the results for our site and we didn't have to do any magic tricks to achieve this level of performance. Innota does a lot out of the box for us. Here are the things Innota does automatically for us:
- All the images are automatically scaled to required dimensions. There's no point using a 4K image in a column with a width of 600px.
- All images are optimized for a small footprint.
- CSS and JavaScript is combined and minified
- We use gzip for all content for browsers that support it.
- We use HTTP/2 for content delivery.
- We have a global content delivery network.
That's a long list of things needed to do and Innota does this completely transparently in the background. In addition we also inlined CSS to some extent, to make the time to first render as small as possible. This isn't a completely automatic process, but Innota makes it easy to inline CSS.
Conclusions
Fast web experience matters. There are great tools you can use to verify the performance of your site and to gain some insights on where room for improvement exists. Short loading times improve user experience and that may lead to better user retention and more sales.
These tools are simple and easy to use and I really recommend using them as a part of your workflow when you're developing a new site.